
Building a CO2 sensor using a Pi PicoW & Automating a Home Ventilation System - Part 1
The first in a 3-part series giving a walk-through of creating a custom co2 sensor using the raspberry pi picow and hooking it up to a home ventilation system.

In this second post, I’ll take you through how (and why) I set up Apache Flink, InfluxDB, and used Grafana & MQTT (mostly running in a Kubernetes cluster!) to display (and eventually use!) our Co2, temperature, and pressure data.
Let’s get into it.
Now that I have my fan unit installed, (link to part one if you haven’t read it) and a custom Co2 sensor built, I want to take the raw data from the sensor, pass it through a streaming application (to clean it.. more on this later) then store it in a database and use this data to control my new fan. Sounds simple, right?
In practice, what does this look like?
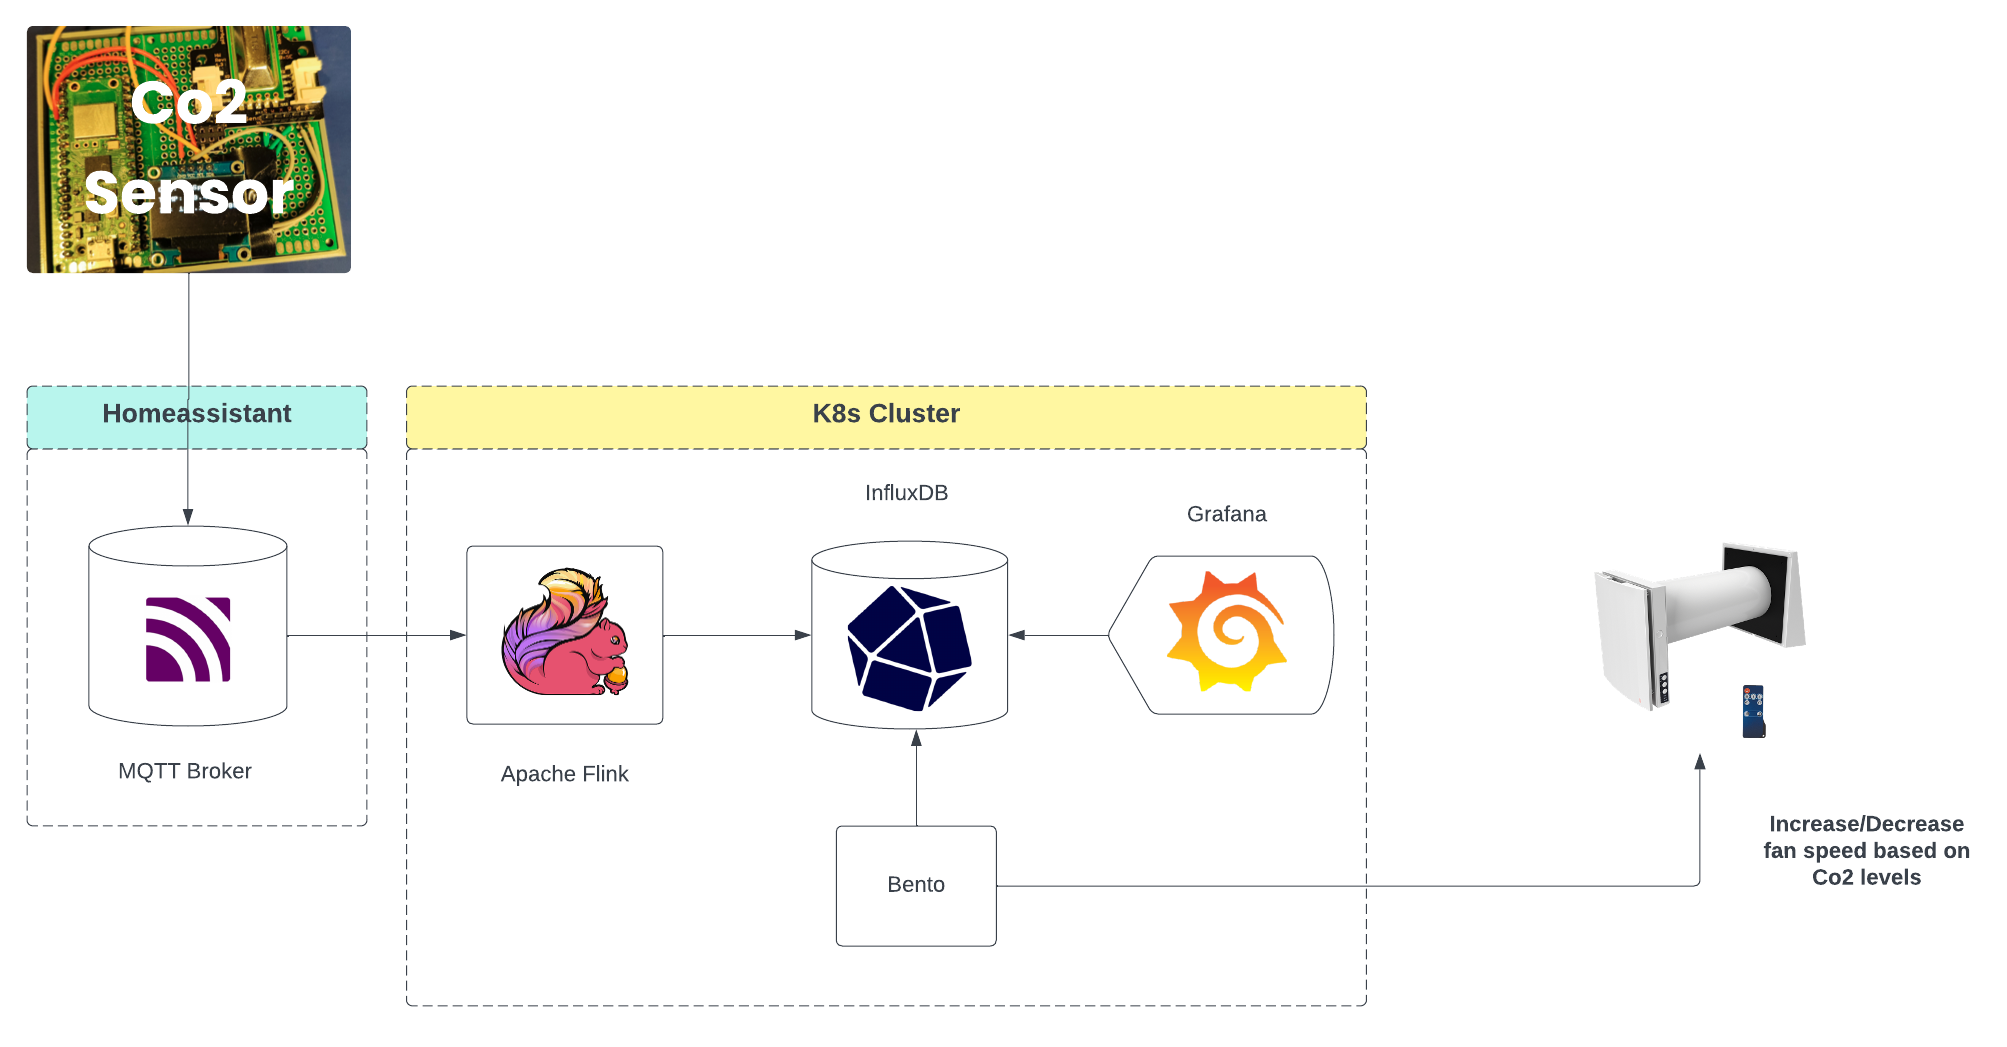
My sensor will send data to an MQTT broker (thanks to my already existing homeassistant), then use this as a data source in apache flink, and sink it to InfluxDb. From there I have Grafana setup to graph the data (obviously), as well as Bento which is the tool I built to control my new fan unit (more on that in the next and final post).
Let me try and describe Flink in a more casual way. Imagine you’ve got a river of data, constantly flowing and never stopping. Apache Flink is like a high-tech waterwheel designed to harness the power of this data river. It’s a tool that processes large data volumes in real-time as they arrive. This is super useful for when you need to make quick decisions based on live data, like catching fraudulent transactions as they happen or keeping an eye on network traffic to spot any issues right away.
But I hear you ask, WHY???
To that question is that I use Flink in my day job, and I wanted to learn more about running it as well as it’s inner workings (I also hadn’t touched Scala since college,so it was an opportunity to get into it again). This seemed like the perfect project to get sunk into that could help me build more then just a cursory knowledge of the technology.
Using Flink also gives me an advantage in that I can process the data before it reaches the sink (InfluxDB) in my case, and this came in particalularly handy as it happens, (as I’ll show later) there is a skew in the data coming from the Co2 sensor which flink can help me to clean & filter out.

In order to read the raw sensor data from MQTT and sink it, we need to define a job.
object Job {
  def main(args: Array[String]): Unit = {
    var env = StreamExecutionEnvironment.getExecutionEnvironment

    if (settings.localDevelopment) {
      env = StreamExecutionEnvironment.createLocalEnvironment(
        settings.flinkSettings.parallelism
      )
    }

    env.getConfig.setAutoWatermarkInterval(1000L)

    val sensorData: DataStream[String] = env
      .addSource(new HiveMqttSource())
      .name("hivemq-source")
      .uid("hivemq-source")

    val readings: DataStream[SensorData] = sensorData
      .process(new ProcessMessage())
      .keyBy(_.nodeId)
      .filter(_.co2 != -1)
      .filter(_.co2 < settings.co2UpperLimit)
      .name("process-readings")
      .uid("process-readings")

    readines
      .addSink(new InfluxDBSink())
      .name("InfluxDB-Sink")
      .uid("InfluxDB-Sink")

    env.execute(settings.applicationName)
  }
}
You can see the full source-code of the flink application by visiting Flink-Home in Github.
The Job class defines the data flow of the Flink application. We read the data
from the source as a datastream: sensorData. Sources ingest data from external
systems, such as Apache Kafka, Rabbit MQ, or in my case MQTT. The source
connects to the broker and waits for events to process.
Once we have data from the source we can process the message using the
ProcessMessage function. The purpose of this step is to transform the raw JSON
data into a new
type
called SensorData so as we can more easily work with it.
Following this, we then keyBy the sensorData using a nodeId. You may
recall in the previous post we added an attribute onto the event we send to the
broker with the same name.
{
  "event": {
    "co2": 502.0,
    "temperature": 18.7,
    "pressure": 1.01324,
    "node_id": 1,
    "timestamp": 1701019647
  }
}
Source is here.
By doing this, it means I can in the future process multiple nodes (my custom
Co2 sensor in this case) by adding more sensors to each room in the house. This
may mean in the future that the stream could contain a lot of events from a
growing number of nodes, such that it needs to be processed in parallel by
multiple tasks in Flink. Since events occur on a per-node basis, we can ensure
that all events for the same node are processed by the same parallel task for
the process-readings operator.
As I hinted at previously, the Co2 sensor can be.. finicky. Typically a room
should have a Co2 range of between 0-1,000 PPM. These equate to typical
concentrations of Co2 in occupied spaces with good air exchange. Going up in the
scale from there can lead to drowsiness with concentrations in the range of
1,000-2,000. Ranges of 2,000-5,000 can lead to headaches, slight nausea etc
and anything above that is considered serious oxygen deprivation which can
result in permanent brain damage, or worse.. Death.
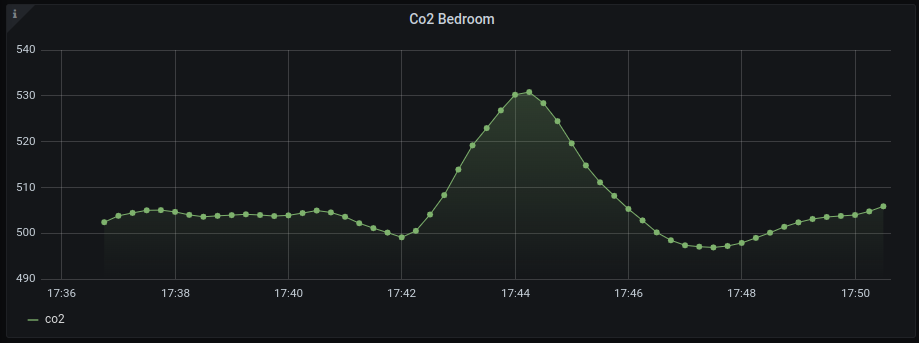
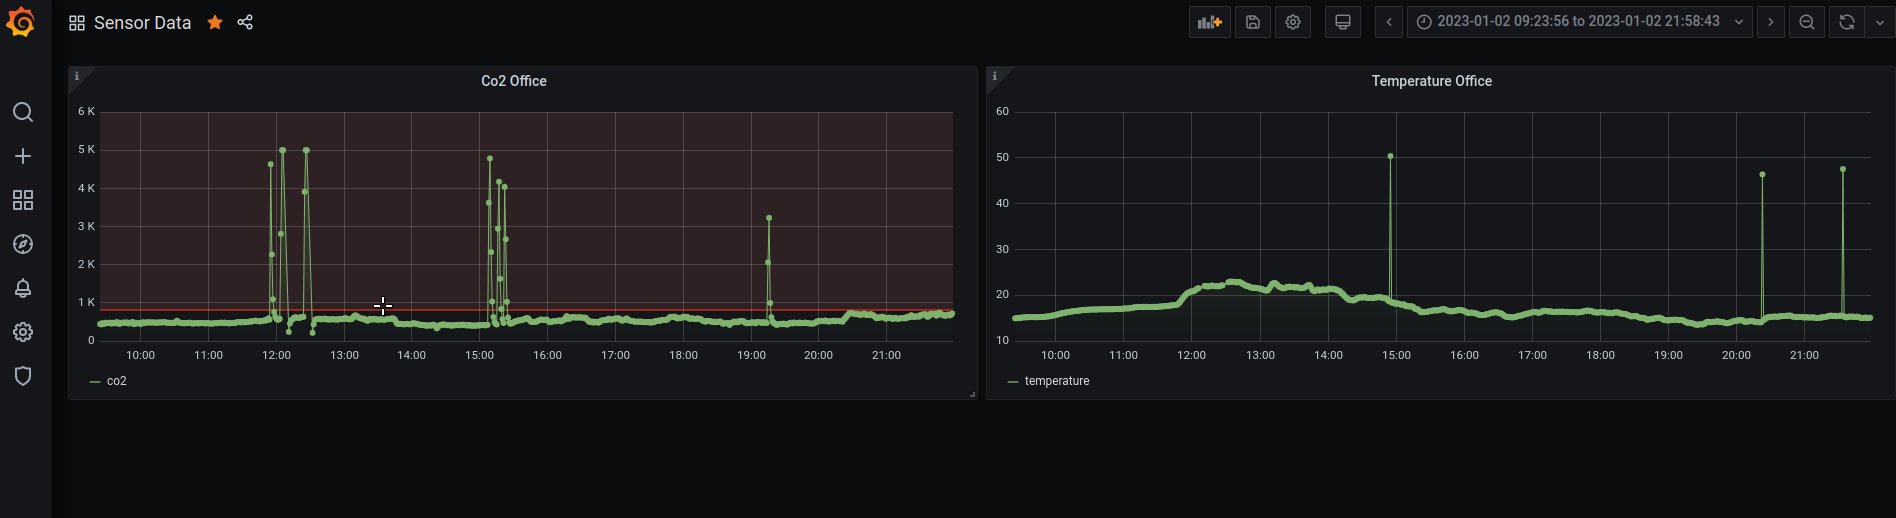
What I quickly noticed (once the data was available in Grafana! Spoiler for later 🤫) was that from time to time and for whatever reason, the sensor would send through wildly inaccurate data before settling back into a normal rythm again. According to it, one minute I’d be fine sucking some nice cool O2, and the next I’d be suffering from asphyxiation, or worse melting alive in 50 degree heat. This was the same across all sensor ranges (Co2, temperature, and pressure). I still have not found what the underlying cause of it is.
So, to combat this I took a simple approach, and filtered any un-wanted values to start.
val readings: DataStream[SensorData] = sensorData
    .process(new ProcessMessage())
    .keyBy(_.nodeId)
    .filter(_.co2 != -1)
    .filter(_.co2 < settings.co2UpperLimit)
    .name("process-readings")
    .uid("process-readings")
When processing the sensorData I added two filters. The first is to throw away
any negative values coming from the sensor, and the second was to add an upper
limit to the co2 values coming through the stream. This way I can remove most
of the noise coming through to have more practical readings in Grafana.
But I didn’t stop there. As the sensor again would send some wild readings, I wanted a way to smooth the data. So I added the following;
// Smooth readings and also filter out insane readings
val smoothReadings: DataStream[SensorData] = readings
  .keyBy(_.nodeId.toString())
  .window(SlidingProcessingTimeWindows.of(Time.minutes(2), Time.seconds(15)))
  .process(new ProcessWindowEvents())
  .name("smooth-readings")
  .uid("smooth-readings")
class ProcessWindowEvents extends ProcessWindowFunction[SensorData, SensorData, String, TimeWindow] {
  def process(key: String, context: Context, input: Iterable[SensorData], out: Collector[SensorData]): Unit = {
    var avgCo2Data: Double = 0
    var avgTempData: Double = 0
    var avgPressureData: Double = 0

    val dataLen = input.size
    val nodeId = input.toList.head.nodeId

    avgCo2Data = input.map(s => {
      s.co2
    }).sum / dataLen

    avgTempData = input.map(s => {
      s.temperature
    }).sum / dataLen

    avgPressureData = input.map(s => {
      s.pressure
    }).sum / dataLen

    val publishedAt: Long = Instant.now().getEpochSecond()

    out.collect(new SensorData(avgCo2Data, avgPressureData, publishedAt, nodeId, avgTempData, publishedAt))
  }
}
One of the most powerful features Flink has to offer is its
window assigners.
What I did above, is create a sliding window of a fixed length, 2 minutes in
this case, which will run our ProcessWindowEvents function every 15 seconds.
The benefit of this, is that flink will keep in its state any number of events
that fall within the window, and we can then caluclate an average for our
sensor readings based on that before outputting it to our sink.
Again, it’s certainly not perfect, but for a small DIY project it works fine for me.
Flink is nice enough to provide us with an streaming connector for InfluxDB, so we don’t have to do too much other than define our sink function, connect to our database and invoke the sink. I won’t detail the entire sink function here, but you can find the full source-code in the Flink-Home project here.
The only other notable thing i might add about the sink, particularly in context
of InfluxDB is that we need to convert our SensorData type to a Point for
InfluxDB to consume.
// Called when data arrives at the sink
override def invoke(data: SensorData, ctx: Context): Unit = {
  val builder: Point.Builder = Point.measurement("Co2Data")
    .time(System.currentTimeMillis(), TimeUnit.MILLISECONDS)
    .tag(s"sensor${data.nodeId.toString()}", "data")
    .addField("co2", data.co2)
    .addField("temperature", data.temperature)
    .addField("pressure", data.pressure)
  val p: Point = builder.build()

  try {
    influxDBClient.write(p)
  } catch {
    case e: Exception => {
      LOG.error("Failed to sink metric to influxDB: {}", e)
    }
  }
}
To get InfluxDB up and running in my home k8s cluster I created a yaml manifest you can find here. It should pretty much work out of the box, the only things one should change are the secrets defined in the manifest as well as the namespace (though I created mine manually).
---
apiVersion: v1
kind: Secret
metadata:
  name: influxdb-secrets
type: Opaque
data:
  INFLUXDB_DB: ZmxpbmtfaG9tZQo=
  INFLUXDB_USER: dXNlcgo=
  INFLUXDB_USER_PASSWORD: cGFzc3dvcmQK
  INFLUXDB_READ_USER: cmVhZG9ubHkK
  INFLUXDB_ADMIN_USER: cm9vdAo=
  INFLUXDB_ADMIN_USER_PASSWORD: cGFzc3dvcmQK
  INFLUXDB_HOST: aW5mbHV4ZGIK
After that, we just run the following to apply the manifest to the cluster.
### Apply secrets
kubectl create secret generic influxdb-secrets --from-file=kubernetes/influxdb/manifest.yaml

### Apply resources
kubectl apply -f kubernetes/influxdb/manifest.yaml
For Flink it’s a similar dance. The manifest can be found here. One thing of note in my case, given I am running K3s on a cluster of raspberrypis running arm and 32bit raspianOS, I had to ensure on at last one node in my cluster I was running the 64bit version of raspianOS as the docker image for Flink is required to run on a 64bit machine. To ensure this, I added a new node in my cluster specifically for 64bit workloads and added a node affinity to the Flink manifest so the deployment will only be scheduled on this node.
spec:
  affinity:
    nodeAffinity:
      requiredDuringSchedulingIgnoredDuringExecution:
        nodeSelectorTerms:
          - matchExpressions:
              - key: machinetype
                operator: In
                values:
                  - arm64
And then;
# Flink
kubectl apply -f kubernetes/flink/manifest.yaml
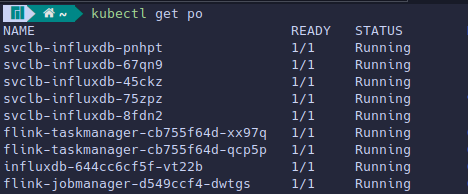 InfluxDB & Apache Flink running in K8s.
Lastly I compile & build the new Flink pipeline using sbt like so;
sbt compile
sbt build
Then using kubectl I can port-forward to the Flink jobmanager and submit the job to start testing it directly in the Flink UI. Just click on “Submit New Job” on the left hand-side and upload your compiled JAR.
kubectl port-forward flink-jobmanager-d549ccf4-p9tcl 8081:8081
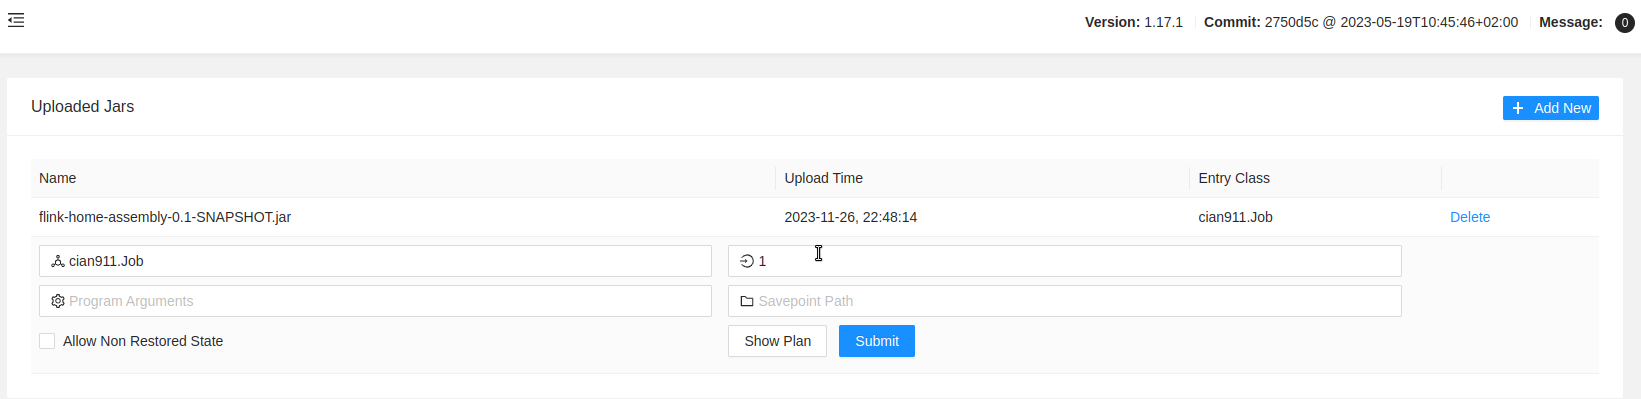
And finally, we have our job running and processing events!
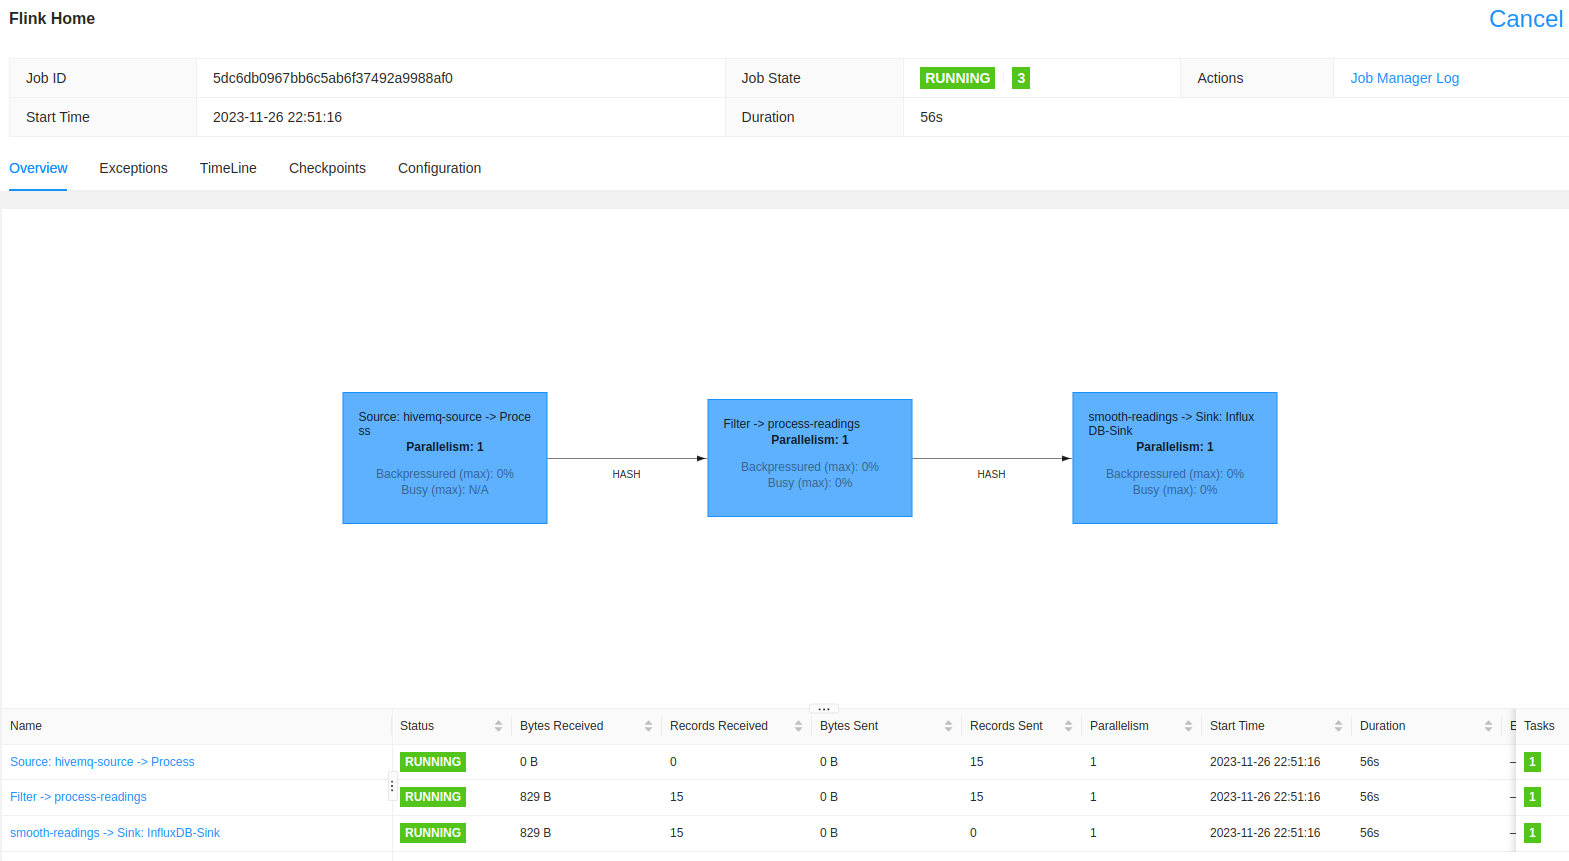
Phew, we’re nearly there.
Now that I have the data in InfluxDB I can add this as a source in Grafana directly. To do this, I select the configuration wheel on the left handside in my Grafana UI and choose “Add data source”. My configuration is detailed below.
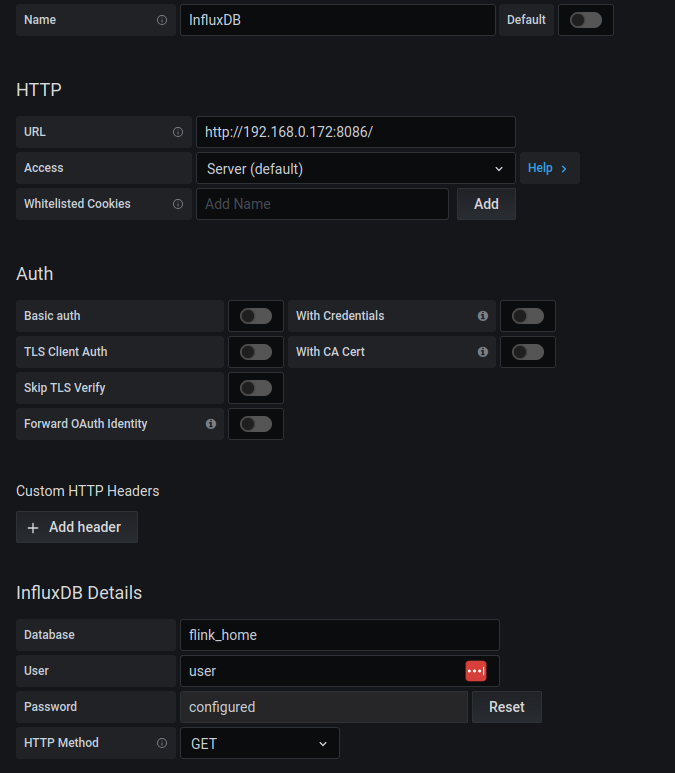
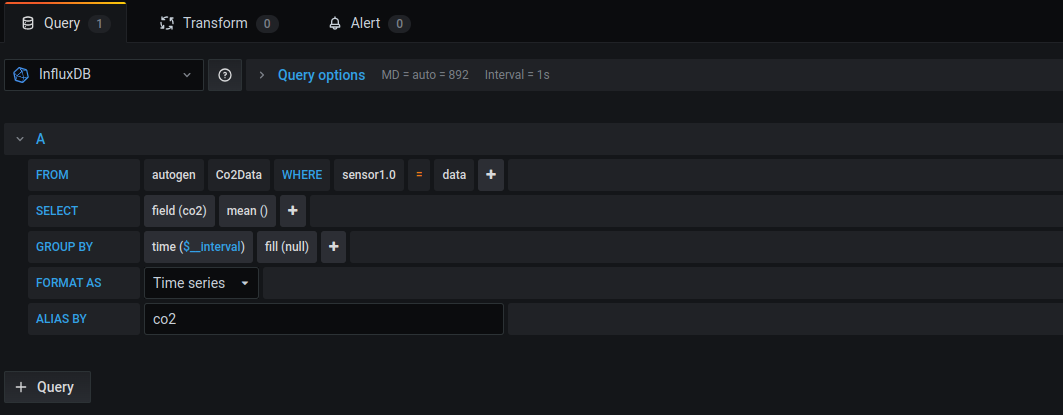
Once that is done and confirmed working, we can create a new dashboard and add a new panel to it and edit. I want to select our data source as “InfluxDB” (obviously) and then I can configure the query like so;
You may recall that in our
sink function
in in Flink, I called the measurement Co2Data and I tagged it as sensor and
the node id (1.0) in my case. So that’s exactly how I’m going to build the
query!
FROM Co2Data WHERE sensor1.0 = data; SELECT field(co2);
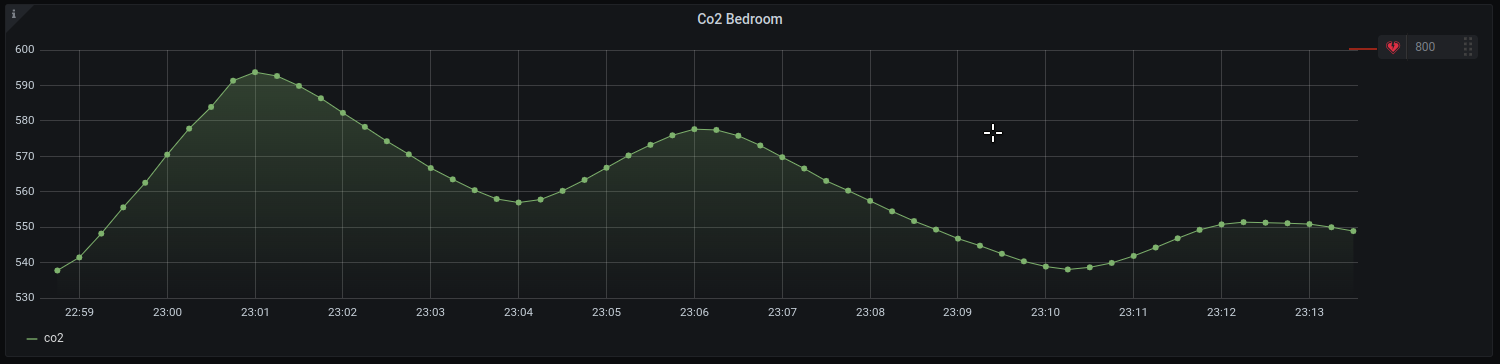
And at last, et voilà.
In the next and final post on this journey, I’ll take you through Bento. Bento is the tool I built to automate my fan speed given our newly stored co2 data. Stay tuned!
The first in a 3-part series giving a walk-through of creating a custom co2 sensor using the raspberry pi picow and hooking it up to a home ventilation system.
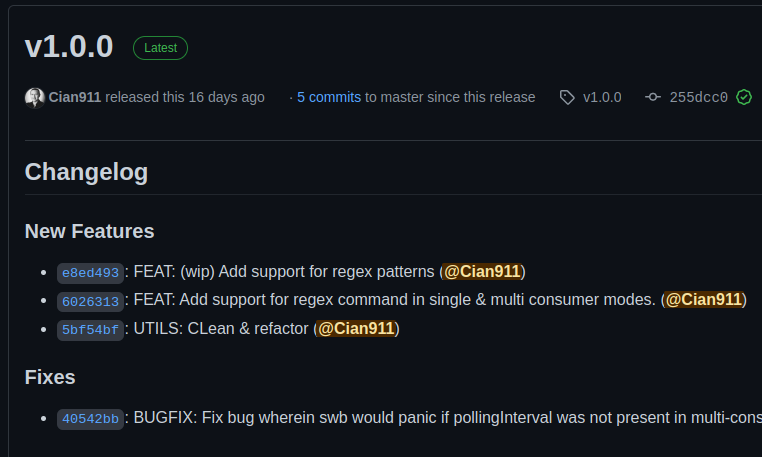
Announcing the release of switchboard v1.0.0 and switchboard-pro.
In this post I introduce you to switchboard. A CLI tool written in Golang to automatically organise files on your machine.
